Java Course
In java, JVM allocates memory to different processes, methods and objects.
I. ClassLoader
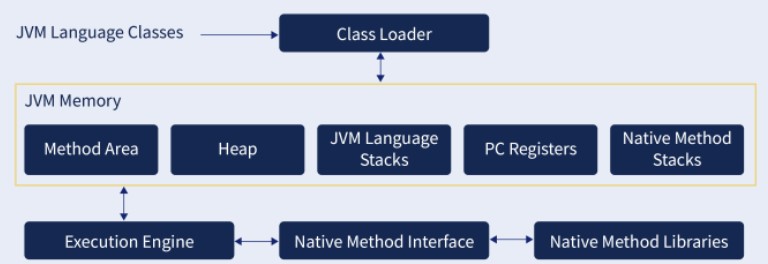
A Java program consists of custom classes (written by programmers) and core classes (pre-packaged with Java). When a program is executed, the JVM must load all the required classes. It uses a ClassLoader to find and load these classes.
The ClassLoader subsystem performs the following steps:
- Loading
- Linking
- Initialization
Loading
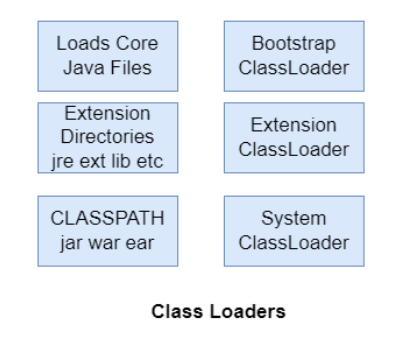
There are three main types of ClassLoaders in Java.
-
System ClassLoader: Loads classes found in the classpath, including custom classes and libraries specified by the user.
-
Extension ClassLoader: Loads classes from the jre/lib/ext directory.
-
Bootstrap ClassLoader: The primordial ClassLoader, responsible for loading core Java classes from rt.jar (before Java 9).
How does classloader works?
- When the JVM requests a class, it calls the
loadClassmethod of the ClassLoader with the fully qualified class name. - The
loadClassmethod first callsfindLoadedClass()to check whether the class is already loaded. - If not, it delegates the request to the parent ClassLoader.
- If the parent ClassLoader can’t find the class, it calls
findClass()to search the filesystem or other sources.
Note: The delegation hierarchy works from System → Extension → Bootstrap ClassLoader.
Bootstrap ClassLoader has the highest priority, followed by Extension, then System.
Linking
It performs the below steps
- Verify: Checks the bytecode to ensure compatibility with the JVM.
- Prepare: Allocates memory for class variables (static fields).
- Resolve: Resolves symbolic references; if a referenced class cannot be resolved, this results in a
NoClassDefFoundError(not to be confused withClassNotFoundException, which is thrown earlier by the ClassLoader during the loading phase when a class cannot be found at all).
Initialization
Initializes static fields to default or configured values, and executes static initializers.
II. JVM Memory Area
The division of total Memory area of JVM is in 5 parts:
- Class (Method) Area
Allocated once per JVM at startup. Stores class-level metadata, static variables, and constant pools.
It is shared across threads and is not thread-safe by default.
Before Java 8, the method area was part of PermGen; since Java 8, it's managed in Metaspace.
- Heap Area
Allocated once per JVM at startup. Stores all objects and instance variables. It is shared across threads and is also not thread-safe by default.
How can we find allocated heap area?
Runtime r = Runtime.getRuntime();
r.maxMemory();     // Maximum heap size
r.totalMemory();   // Current heap size
r.freeMemory();    // Free heap space
How to set maximum & minimum heap sizes?
- By using command prompt execution of program
java -Xmx512m JavaProgramFileName

java -Xms64m JavaProgramFileName
Where Xmx indicates Maximum Memory & Xms indicates Minimum Memory. Heap memory is finite memory but based on our requirement we can set max & min heap sizes
- By Setting 'JAVA_OPTS' as a system variable
JAVA_OPTS="-Xms256m -Xmx512m"
After that in a command prompt run the following command:
SET JAVA_OPTS="-Xms256m -Xmx512m"
This setting indicates allocating minimum 256MB and maximum 512MB of heap.
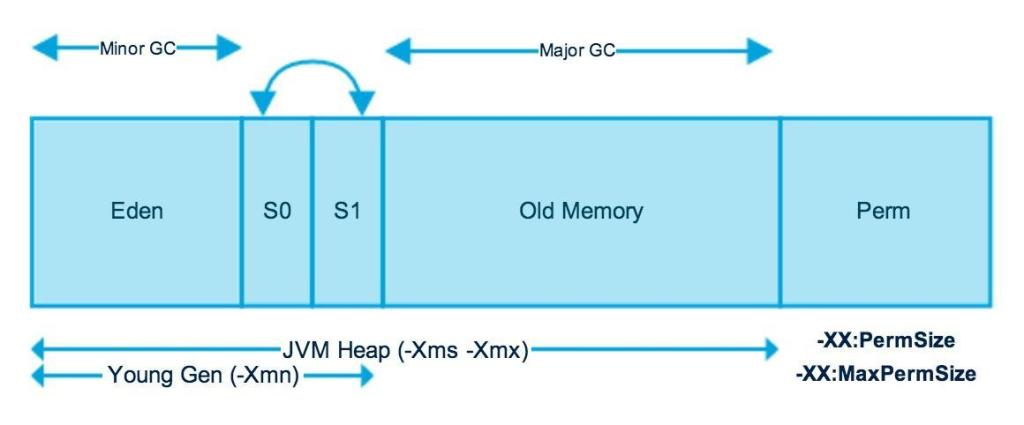
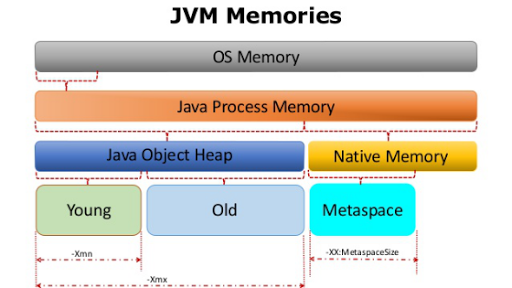
Heap divisions:
- Young Generation: short-lived objects.
- Old (Tenured) Generation: long-lived objects.
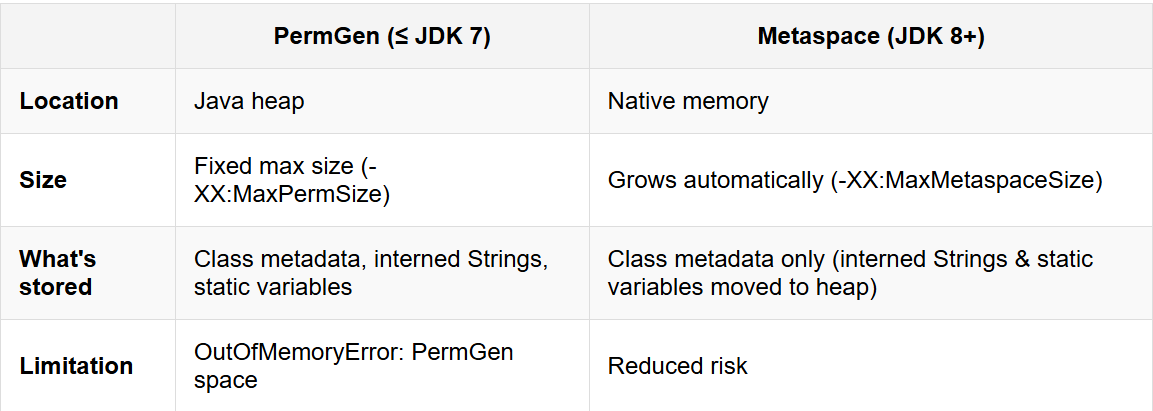
- PermGen (before Java 8): metadata.
- Metaspace (Java 8+): metadata stored in native memory.
When heap memory is exhausted, we see this error java.lang.OutOfMemoryError: Java Heap Space
PermGen vs Metaspace
- Stack Area
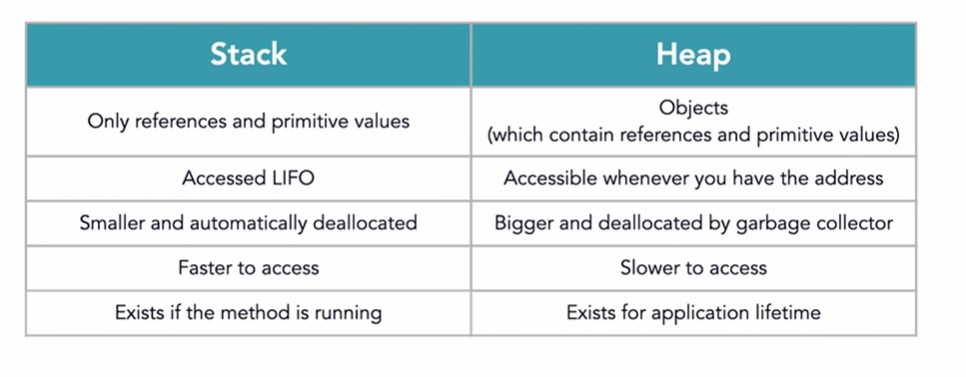
Each thread has its own stack, created at thread startup.
Used to store:
- Local variables
- Method parameters
- References to heap objects
Stack memory follows LIFO (Last-In-First-Out) order.
When stack is full, we see this error java.lang.StackOverflowError.
Stack frames consist of:
- Local variable array
- Operand stack
- Frame data (symbolic references & exception info)
Stack memory is typically small and can be adjusted:
java -Xss512k "Class Name"
Stack vs Heap
- Program Counter Register
Each thread has a PC register storing the address of the currently executing JVM instruction.
- Native Method Stack
Each thread also has a separate stack for native method calls.
Here with pointers on JVM Memory Area:
- Static Variables are stored in Method area.
- Instance Variables are stored in Heap area.
- Local Variables are stored in Stack area.
III. Execution Engine
Responsible for running bytecode.
Consists of:
- Interpreter: Quickly interprets bytecode, line by line.
- JIT Compiler: Improves performance by compiling frequently used methods (“hotspots”) to native code.
Process:
- JVM initially uses the interpreter.
- When a method's call count exceeds a threshold, the JIT compiler compiles it to native code.
- JVM then runs this native code directly, boosting performance.
JIT compilation includes:
- Intermediate code generation
- Code optimization
- Target code generation
Note: JIT is applied selectively; the whole program is still interpreted at least once.
IV. JNI (Java Native Interface)
Enables Java code to call or be called by native libraries (usually C/C++).
Acts as a bridge between JVM and native code.
V. Stack and Heap Example
public class Memory {
    public static void main(String[] args) { // Step 1
        int i = 1;                          // Step 2
        Object obj = new Object();          // Step 3
        Memory mem = new Memory();          // Step 4
        mem.foo(obj);                       // Step 5
    }                                       // Step 9
    private void foo(Object param) {        // Step 6
        String str = param.toString();      // Step 7
        System.out.println(str);
    }                                       // Step 8
}
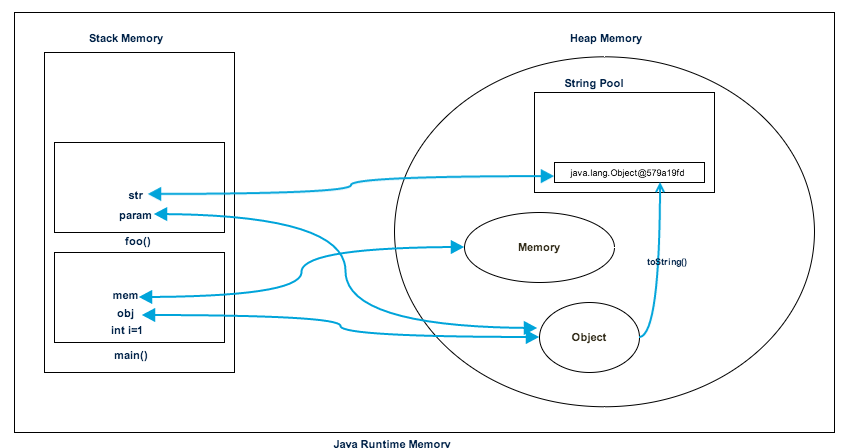
Let's go through the steps of execution of the program (these are execution steps, not source line numbers).
- At step 1,
main()method’s stack frame is created. - Step 2:
iis stored in the stack. - Steps 3 & 4:
objandmemobjects created in heap; references stored in stack. - Step 5: call to
foo(), new stack frame is created. - Step 7:
strcreated in heap (String pool); reference in stack. - After step 8,
foo()frame is removed; after step 9,main()frame is removed; heap and stack are freed.
VI. Garbage Collection
Automatic process to reclaim memory by removing unreachable objects in the heap.
Heap generations:
- Young Generation: new objects.
- Old Generation: long-lived objects.
- PermGen/Metaspace: metadata.
GC Types:
- Minor GC: in Young Generation; fast.
- Major GC: in Old Generation; slower.
- Full GC: cleans both Young & Old Generations.
Collectors:
- Serial GC: Single-threaded; pauses all application threads.
- Parallel/Throughput GC: Multi-threaded; also stops application threads.
- CMS GC: Concurrent Mark Sweep; less stop-the-world time.
- G1 GC: Divides heap into regions; prioritizes garbage in regions to meet pause-time goals.
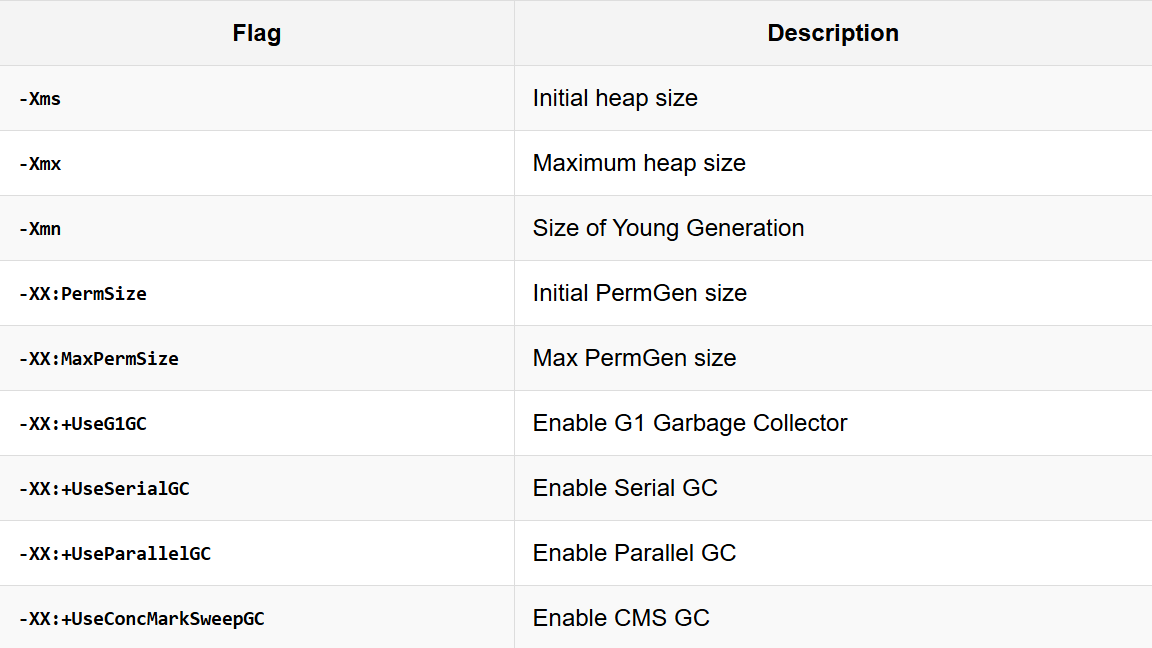
Common JVM GC options: