Kubernetes Course
Built-in Observability with kubectl
Before reaching for dedicated tooling, kubectl itself provides the first line of debugging for almost every Kubernetes issue:
kubectl get pods -o wide                 # Status, node, IP at a glance
kubectl describe pod <name>              # Events section shows scheduling/health failures
kubectl logs <pod-name>                  # Container logs
kubectl logs <pod-name> -c <container>   # Logs from a specific container in a multi-container Pod
kubectl logs <pod-name> --previous       # Logs from the previous instance, after a crash/restart
kubectl exec -it <pod-name> -- /bin/sh   # Open a shell inside a running container
kubectl top pods                          # Live CPU/memory usage (requires metrics-server)
kubectl top nodes
kubectl describe pod is usually the single most useful troubleshooting command in Kubernetes — its Events section shows the exact reason a Pod is stuck: ImagePullBackOff, CrashLoopBackOff, FailedScheduling (often due to insufficient resources or unmet node affinity), or failed probes.
Common Pod Failure States
| Status | Typical Cause |
|---|---|
| ImagePullBackOff | Wrong image name/tag, private registry auth missing, or registry unreachable |
| CrashLoopBackOff | Container starts and exits repeatedly — check kubectl logs --previous |
| Pending | Scheduler can't place the Pod — insufficient node resources, unsatisfied affinity/taint rules, or no PVC bound yet |
| OOMKilled | Container exceeded its memory limit and was killed by the kernel |
| Evicted | Node ran low on resources (memory/disk pressure) and the kubelet evicted lower-priority Pods |
The metrics-server and Horizontal Pod Autoscaling
kubectl top and autoscaling both depend on the metrics-server add-on, which collects lightweight CPU/memory metrics from every kubelet (not to be confused with a full monitoring stack like Prometheus, which stores history and supports custom queries).
kubectl apply -f https://github.com/kubernetes-sigs/metrics-server/releases/latest/download/components.yaml
With metrics-server running, a HorizontalPodAutoscaler (HPA) can automatically scale a Deployment based on observed load:
apiVersion: autoscaling/v2
kind: HorizontalPodAutoscaler
metadata:
  name: backend-hpa
spec:
  scaleTargetRef:
    apiVersion: apps/v1
    kind: Deployment
    name: backend-deployment
  minReplicas: 2
  maxReplicas: 10
  metrics:
    - type: Resource
      resource:
        name: cpu
        target:
          type: Utilization
          averageUtilization: 70
kubectl get hpa
kubectl describe hpa backend-hpa
This scales backend-deployment between 2 and 10 replicas, targeting an average CPU utilization of 70% across all Pods — Kubernetes' resources.requests.cpu on each Pod (covered in the Pods lesson) is what "100% utilization" is measured against.
Production Monitoring: Prometheus and Grafana
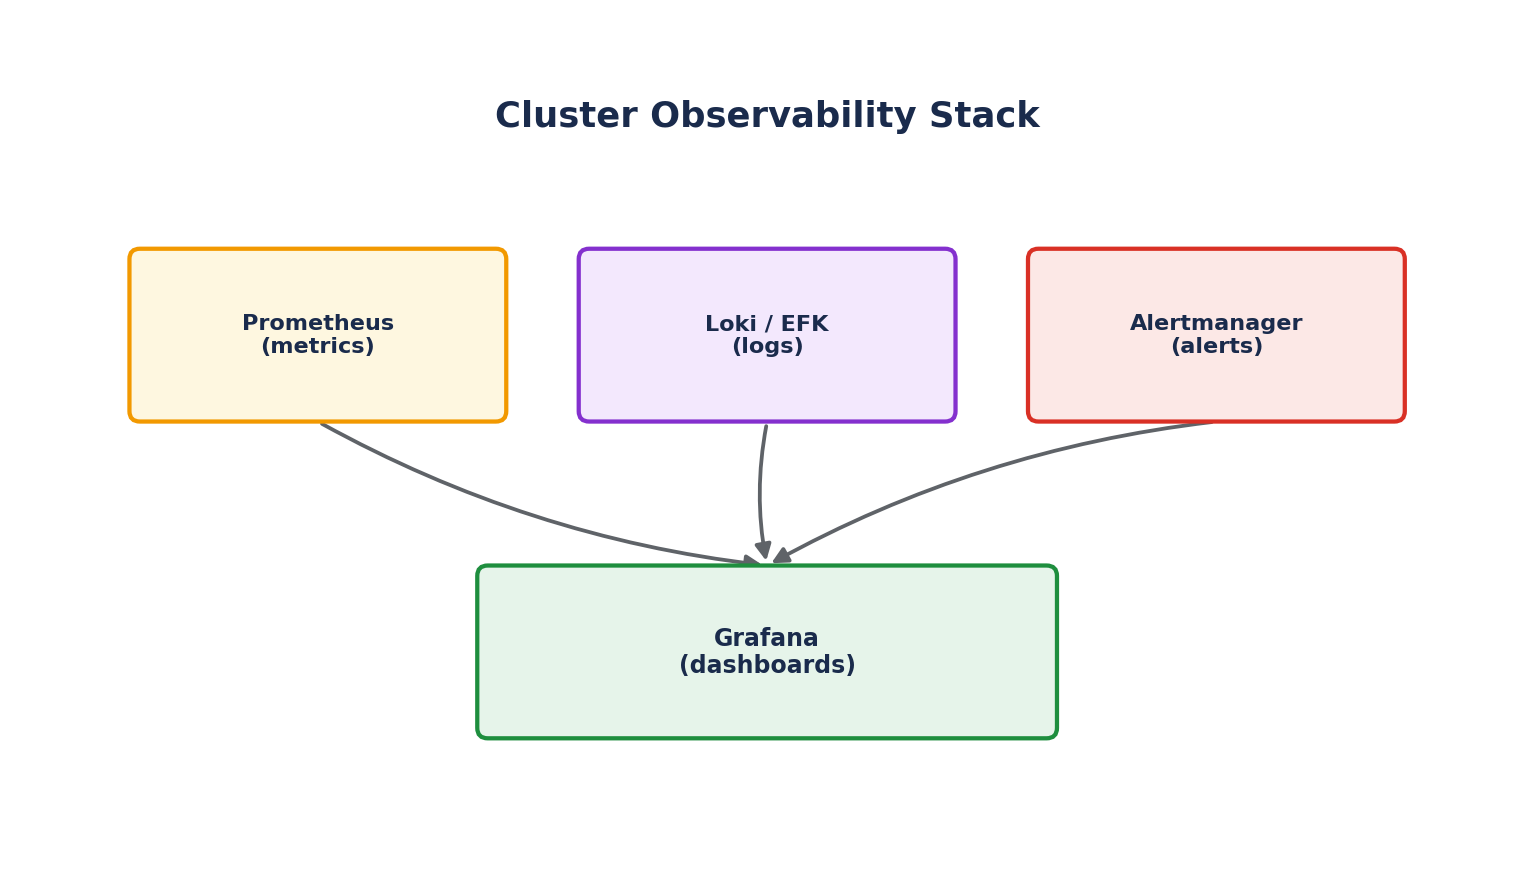
For anything beyond basic resource metrics, the de facto standard observability stack in the Kubernetes ecosystem is:
- Prometheus: A time-series database that periodically scrapes metrics endpoints exposed by applications and cluster components, storing historical data and supporting a powerful query language (PromQL).
- Grafana: A dashboarding tool that visualizes Prometheus (and other) data sources as graphs, alerts, and dashboards.
- Alertmanager: Handles routing and deduplication of alerts fired by Prometheus rules — to Slack, PagerDuty, email, etc.
The kube-prometheus-stack Helm chart installs all three, pre-configured with dashboards and alerts for core Kubernetes components, as a single command:
helm repo add prometheus-community https://prometheus-community.github.io/helm-charts
helm install monitoring prometheus-community/kube-prometheus-stack --namespace monitoring --create-namespace
Centralized Logging
Container logs written to stdout/stderr are captured by the container runtime and readable via kubectl logs — but they're lost when the Pod is deleted, and there's no way to search across many Pods at once. A centralized logging pipeline solves this, typically following one of two patterns:
- DaemonSet-based collection (most common): A log-shipping agent (Fluentd, Fluent Bit, Filebeat) runs as a DaemonSet on every node, tailing container log files from the node's filesystem and forwarding them to a central store (Elasticsearch, Loki, a cloud logging service).
- Sidecar-based collection: A logging sidecar container runs inside each Pod that needs it — used less often, since it multiplies resource usage per Pod compared to one DaemonSet per node.
A very common, lightweight combination in the Kubernetes ecosystem is Fluent Bit → Loki → Grafana, since Grafana can then show both metrics (from Prometheus) and logs (from Loki) side by side.
Debugging Checklist
When a workload isn't behaving as expected, work through these in order:
kubectl get pods— is the Pod evenRunning, or stuck inPending/CrashLoopBackOff/etc.?kubectl describe pod <name>— check the Events section for the root cause.kubectl logs <name> [--previous]— check application-level errors.kubectl get events --sort-by=.lastTimestamp -n <namespace>— cluster-wide recent events, useful when you're not sure which object is the problem.kubectl get endpoints <service-name>— if traffic isn't reaching a Pod, confirm the Service actually has that Pod as an endpoint (a mismatched label selector is one of the most common real-world misconfigurations).kubectl exec -it <pod> -- sh— shell into the container to check things directly, when logs alone aren't enough.