Spring Boot Course
Spring Boot Actuator provides production-ready monitoring and management features for your application — health checks, metrics, configuration inspection, thread dumps, log-level management, and more. These features are exposed via HTTP endpoints (prefixed /actuator) or JMX.
How to Enable Spring Boot Actuator
Add the dependency:
<dependency>
  <groupId>org.springframework.boot</groupId>
  <artifactId>spring-boot-starter-actuator</artifactId>
</dependency>
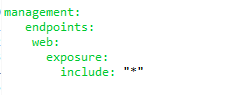
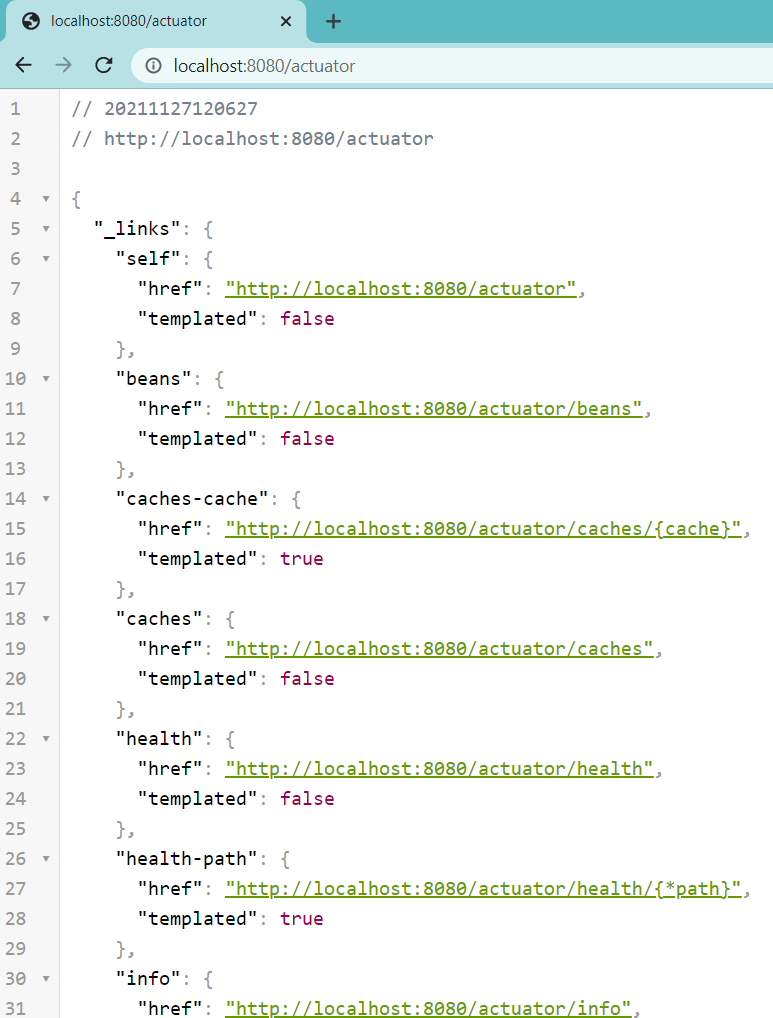
By default, only /actuator/health and /actuator/info are exposed over HTTP. To expose all endpoints (suitable for development; secure appropriately in production — never expose all actuator endpoints to the public internet without authentication):
management:
  endpoints:
    web:
      exposure:
        include: "*"
  endpoint:
    health:
      show-details: always
Actuator Endpoints
1. /actuator/health
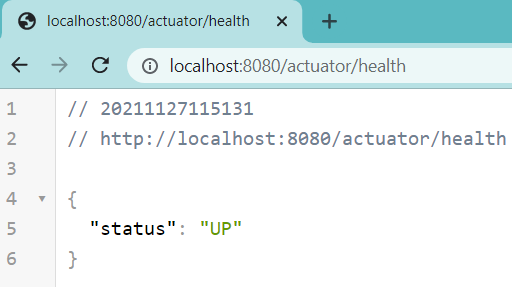
Returns {"status":"UP"} when the application is healthy. Status is DOWN when a health indicator reports a problem (database unreachable, disk space low, custom health check failed, etc.).
Detailed health output (requires management.endpoint.health.show-details: always or when-authorized):
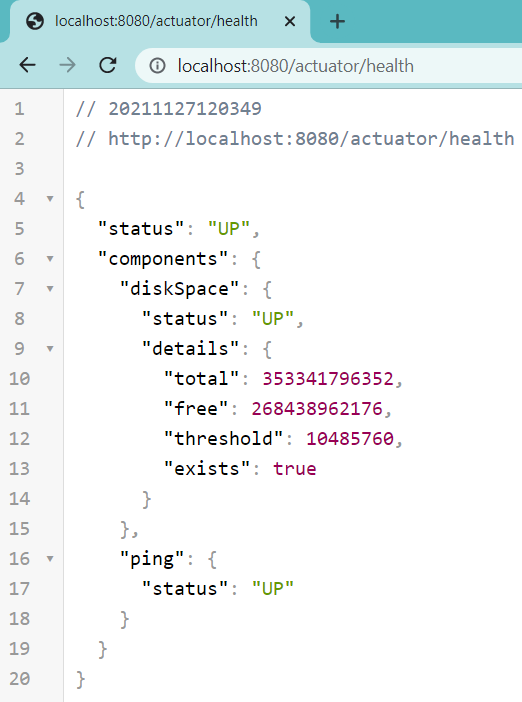
Health indicators run automatically for common infrastructure: DataSource (connection pool), Elasticsearch, Redis, RabbitMQ, Kafka, disk space, etc. You can write custom HealthIndicator implementations and register them as Spring beans.
In Kubernetes deployments, /actuator/health is commonly split into /actuator/health/liveness and /actuator/health/readiness — Spring Boot 2.3+ supports this natively:
management:
  endpoint:
    health:
      probes:
        enabled: true
Kubernetes livenessProbe uses /actuator/health/liveness and readinessProbe uses /actuator/health/readiness — these have different semantics: liveness failure causes a pod restart; readiness failure removes the pod from the service's load-balancer rotation.
2. /actuator/metrics
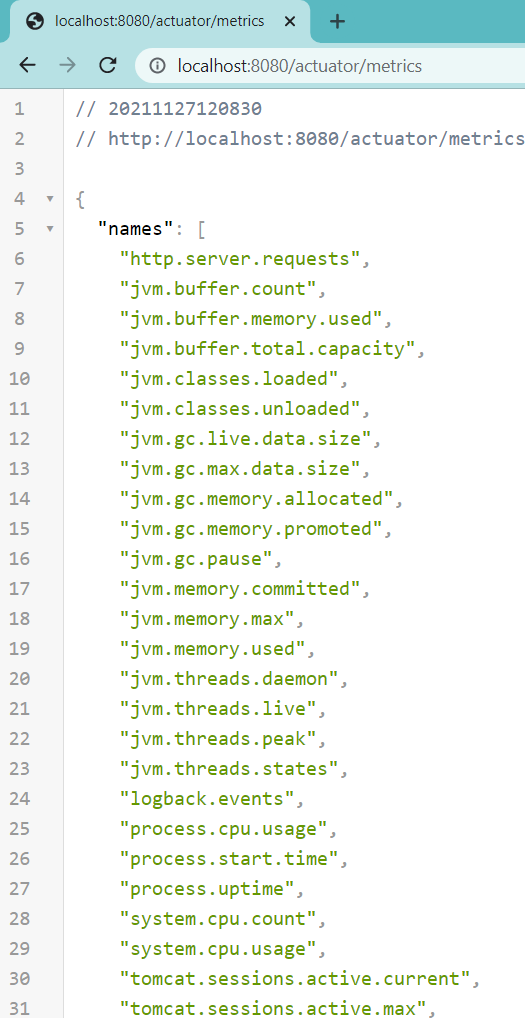
Lists all available metrics. Spring Boot integrates with Micrometer — a vendor-neutral application metrics facade. Out of the box you get JVM memory, GC, CPU, thread counts, HTTP request counts and latencies, DataSource pool metrics, and more.
To query a specific metric:
GET /actuator/metrics/http.server.requests
GET /actuator/metrics/jvm.memory.used?tag=area:heap
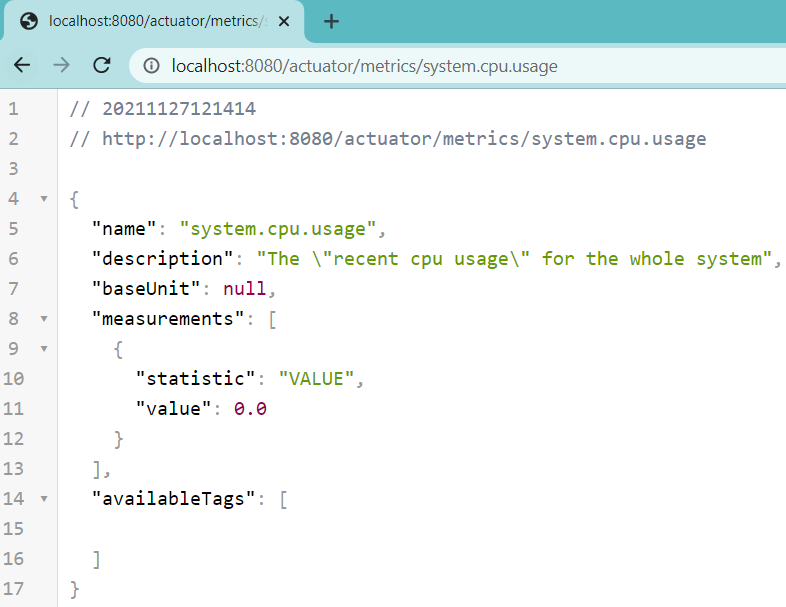
In production, you'd typically scrape these via Prometheus (/actuator/prometheus with micrometer-registry-prometheus) rather than reading raw JSON endpoints — and visualize in Grafana. Add io.micrometer:micrometer-registry-prometheus to pull this in.
3. /actuator/loggers
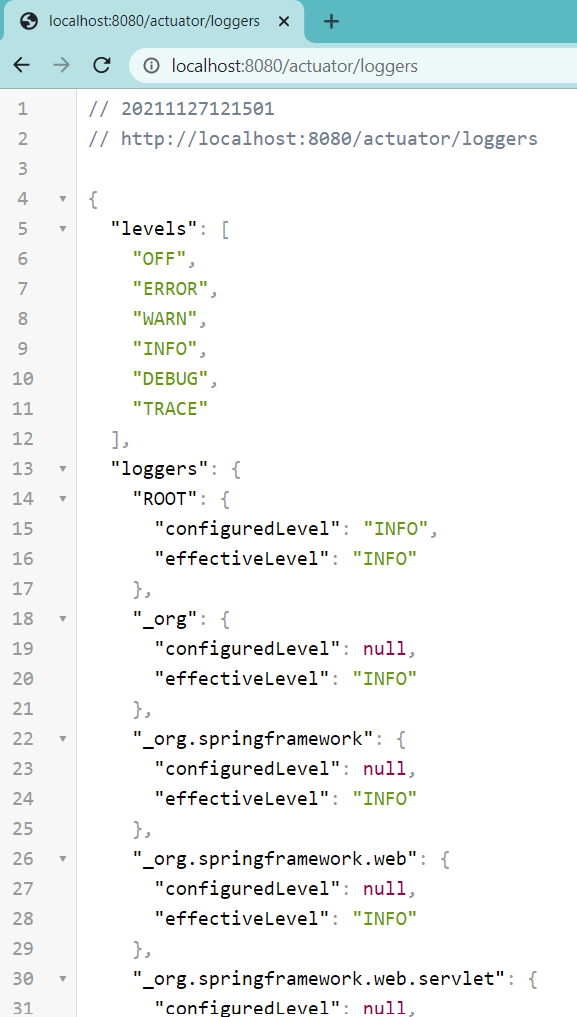
View the configured log level for any logger in the application. Crucially, you can also change log levels at runtime without restarting — extremely useful in production when you need to temporarily enable DEBUG logging for a specific package:
# Enable DEBUG for a specific package at runtime
curl -X POST http://localhost:8080/actuator/loggers/com.praveen.employee \
  -H "Content-Type: application/json" \
  -d '{"configuredLevel": "DEBUG"}'

# Reset to default
curl -X POST http://localhost:8080/actuator/loggers/com.praveen.employee \
  -H "Content-Type: application/json" \
  -d '{"configuredLevel": null}'
4. /actuator/info
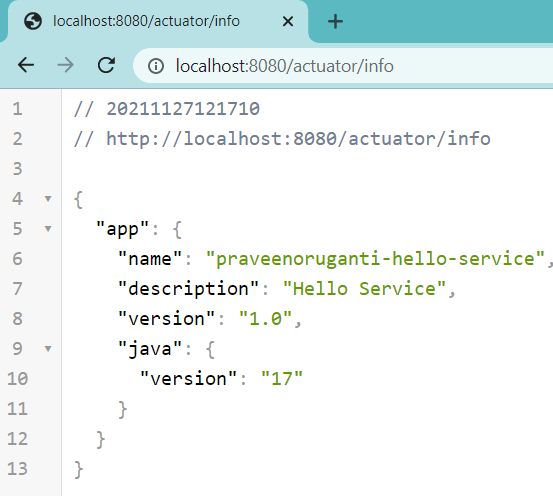
Add custom application information surfaced at this endpoint:
info:
  app:
    name: "@project.name@"
    description: "@project.description@"
    version: "@project.version@"
  java:
    version: "@java.version@"
Spring Boot 2.6+ disabled the info endpoint by default over HTTP — explicitly expose it: management.endpoints.web.exposure.include: health,info,metrics,...
5. /actuator/beans
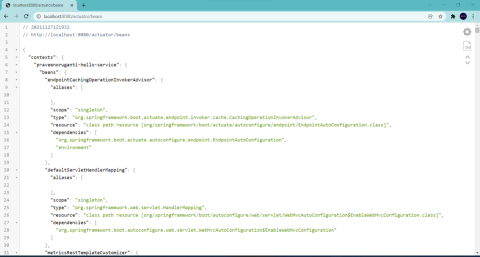
Lists all Spring beans registered in the ApplicationContext — type, scope, dependencies, and the auto-configuration class that registered them. Very useful for debugging why a bean is or isn't being created.
6. /actuator/conditions (formerly /autoconfig)
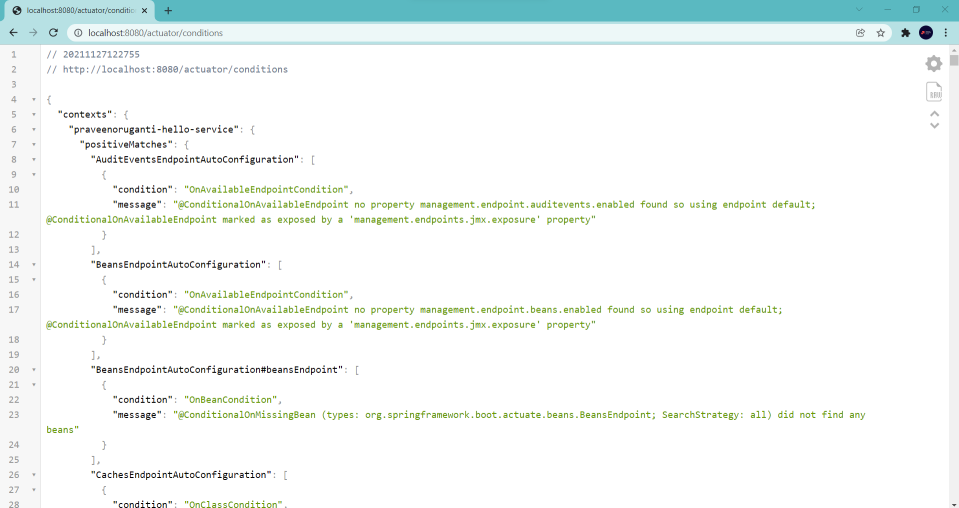
Shows the auto-configuration report: which @ConditionalOn* conditions matched (positive matches) and which didn't (negative matches), and why. Essential for understanding why a particular auto-configuration is or isn't active.
7. /actuator/mappings
Lists all @RequestMapping, @GetMapping, @PostMapping, etc. request paths declared in the application — including which controller method handles each one, accepted content types, and response types. Useful for documenting or auditing API surface.
8. /actuator/configprops
Shows all properties bound via @ConfigurationProperties beans — your custom app config as well as Spring Boot's own auto-configuration properties. Sensitive values are sanitized (keys containing "password", "secret", "token", "key", "credentials" are masked).
9. /actuator/env
Exposes all property sources in Spring's Environment — active profiles, application.yml, system environment variables, JVM system properties, and their effective values. Sensitive values are masked. Useful for verifying which config value is actually active at runtime.
10. /actuator/httptrace (Spring Boot 2.x) / removed in Spring Boot 3.x
Important: The /trace endpoint was renamed to /actuator/httptrace in Spring Boot 2.x, and then removed from Spring Boot Actuator in Spring Boot 3.0. It is no longer available by default in Spring Boot 3.x. If you need HTTP request tracing in Spring Boot 3.x, use Spring Cloud Sleuth/Micrometer Tracing with Zipkin/Jaeger, or integrate with an observability platform. Referring to this as /trace is outdated as of Spring Boot 2.x.
11. /actuator/threaddump
Returns a dump of all running threads, their states, and stack traces — the same information you'd get from jstack or a heap dump tool. Useful for diagnosing deadlocks and thread starvation in production.
12. /actuator/logfile
If file-based logging is configured (logging.file.name or logging.file.path), this endpoint streams the log file content. Only meaningful for local/VM deployments — in containerized environments (Kubernetes), log files should not be written to disk; logs go to stdout and are collected by the platform.
13. /actuator/shutdown
Allows a graceful shutdown of the application via HTTP POST. Disabled by default:
management:
  endpoint:
    shutdown:
      enabled: true
curl -X POST http://localhost:8080/actuator/shutdown
Important: Never expose this endpoint publicly without authentication. In production environments, application shutdown is typically handled by the orchestrator (Kubernetes, systemd) — this endpoint is mostly useful in local development or specific controlled automation scenarios.
Security Note
In production, Actuator endpoints should be:
- Exposed only to internal/admin networks, not publicly
- Protected with Spring Security (e.g., require an
ACTUATOR_ADMINrole) - Or moved to a separate management port (
management.server.port: 8081) that is not load-balanced to the public
management:
  server:
    port: 8081    # expose actuator on a separate port not reachable by external load balancer